
Data snapshot and why precision matters
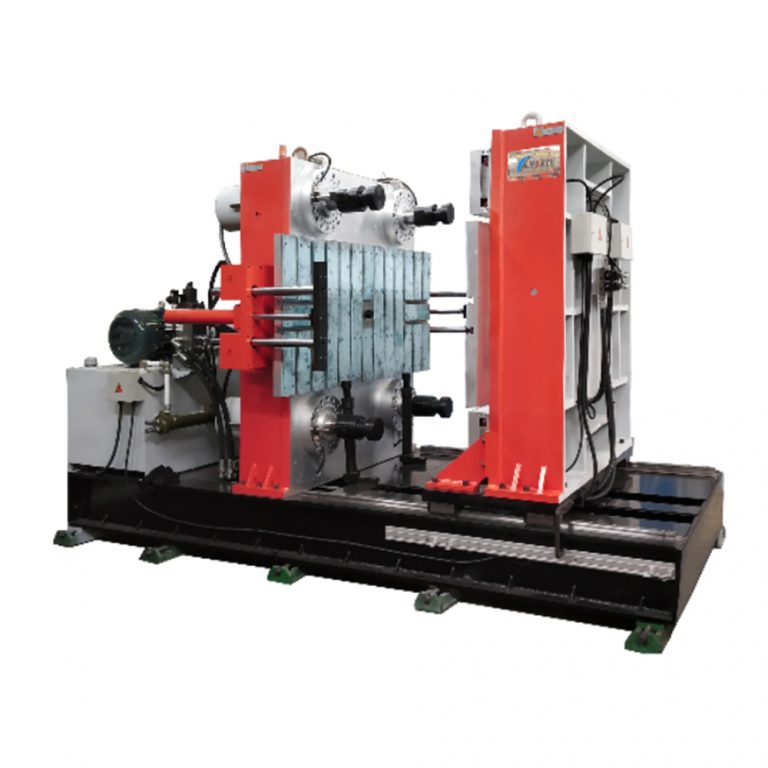
Manufacturers today face clear targets: policy drivers such as the EU Green Deal and commitments under the Paris Agreement mean suppliers must report credible numbers. Start with baseline figures — energy per molding cycle, CO2e per shipped kilogram, and transport kg‑km — and compare them across bids. When you evaluate a vendor, request measured cycle energy for their horizontal rubber injection molding machine: that single figure often predicts both production cost and lifecycle emissions. LSR processing, for example, has distinctive thermal profiles and should be benchmarked separately from standard rubber.
Where emissions and energy are actually consumed
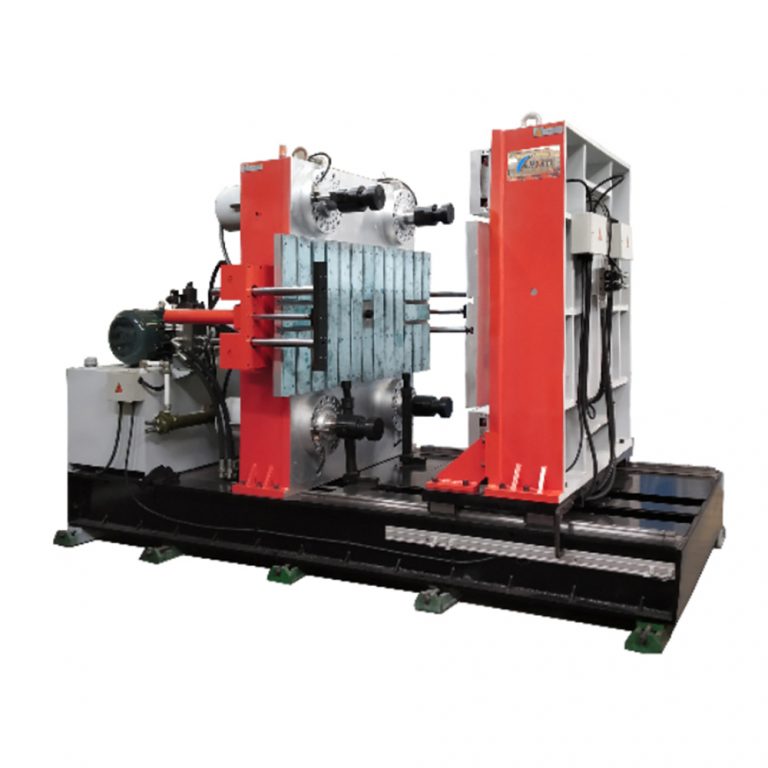
Emissions are not only a factory problem. They appear across the chain: raw rubber compounding, component machining, mold maintenance, molding cycles, and final transport. Heat for curing and idle energy from presses with high clamping force can dominate in some setups. Short cycle times reduce per-part energy but may raise scrap if molds aren’t stable — a balance you must quantify. — Packaging choices and consolidation of pallets often change shipment carbon by double-digit percentages.
Practical metrics engineers and procurement must track
Adopt simple, auditable metrics that connect to decision-making. Useful measures include:
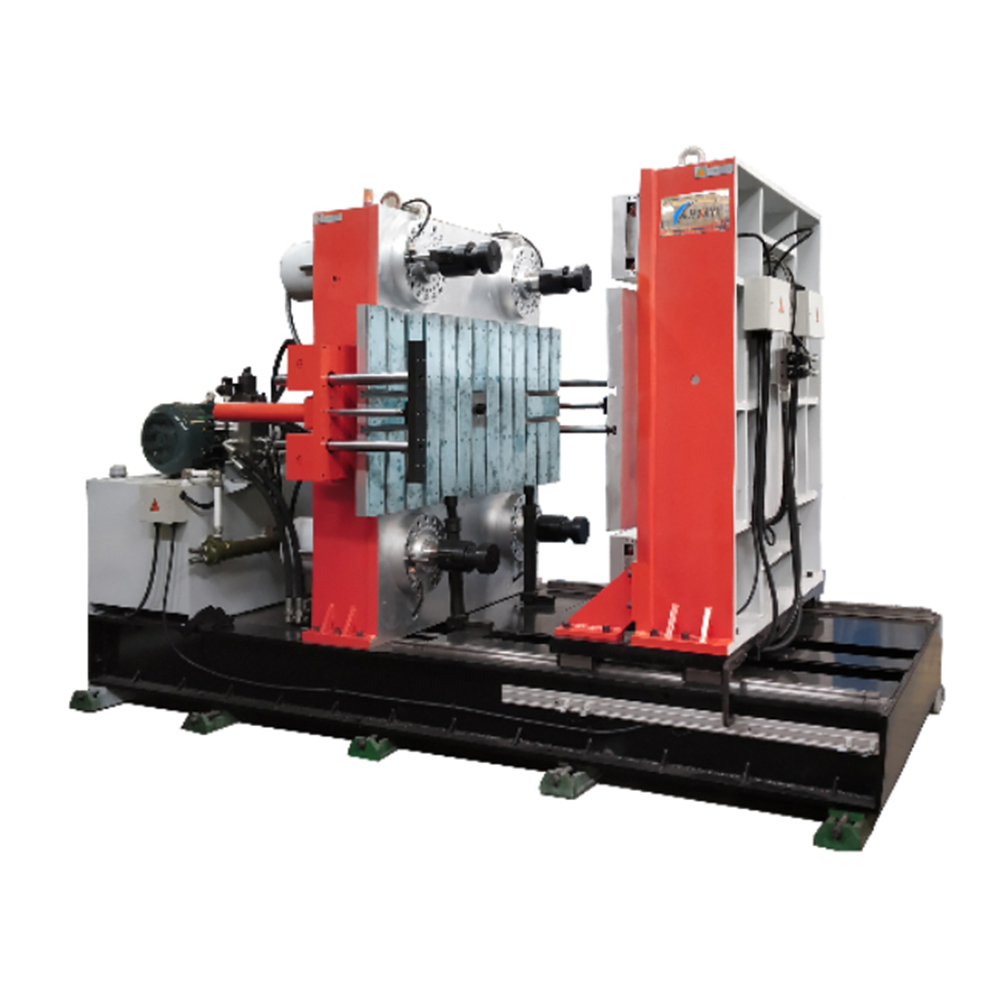
– kWh per part (measured at the machine mains). – CO2e per part (scope 1 and scope 2 emissions, plus a transport allocation). – Transport intensity (kg‑km per shipment consolidated). – Yield rate and rework percentage (waste multiplies energy and material impacts).
Also monitor process-level numbers such as shot size and dwell time; small changes there often produce measurable energy savings without capital investment.
Supplier scorecard: demand transparent, comparable data
When you draft RFQs, make environmental clarity mandatory. Require documented electricity consumption curves for molding cycles and third‑party verification for any claimed offsets. Compare suppliers on these attributes:
– Verified kWh per 1,000 parts and CO2e per kg. – Evidence of energy management systems (ISO 50001) or portfolio-level renewable sourcing. – Consolidation strategies for ocean vs air freight and packaging minimisation. – Tooling maintenance plans that reduce scrap and prolong mold life.
If the supplier references specific equipment, check their horizontal injection molding footprint across comparable models — the same model family can vary widely by configuration and local grid source.
Common mistakes and viable alternatives
Procurement often faults suppliers for price without tracing embedded energy. Two recurring errors: accepting generic emissions factors and ignoring shipment geometry that raises empty return trips. Practical alternatives reduce scope and cost: nearshoring to hubs closer to assembly, using rail for regional moves, and negotiating consolidated LTL container loading. Small design changes can reduce material use and shot size, which lowers both cost and emissions.
Advisory: three golden rules for selecting sustainable OEM components
1) Require line-item energy per cycle and CO2e per shipped unit — accept no averages. 2) Prioritise suppliers that show continuous improvement (annual reductions in kWh/part and scrap rates). 3) Score logistics: prefer consolidated sea freight with documented kg‑km advantages over expedited air. These rules give procurement and engineering a single language for trade-offs, measurable over quarters.
HWAYI integrates measured equipment performance into quotes, helping teams move from promises to numbers — practical, verifiable, and ready for supplier comparison. — Final thought: data without action is just a report fragment.